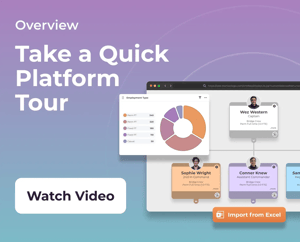
0:00 It's completely dynamic and self-updating. So, at a glance, what we can see here is the organizational structure. 0:10 Now, by dynamic, what we mean is you can click in and out of each employee's profile, and these are self-updating when changes occur. 0:19 So, if we drop down some of these departments here, we can see Claire Spencer as the head of our music faculty, and so on and so forth with the rest of our departments there. 0:33 At a glance, there's a couple of things that you can do with your org chart. The first thing that you can do is you can info surface onto the nodes. 0:42 So, the node is this square, and that's what we refer to as the node. And we can see that at a glance, we can see what Claire's, ah, department is, as well as what basis she is employed under from the surface. 0:57 So, to do this, we would select our com. We'll here, and select info surfacing, and we can decide what information from her profile we'd like to surface to the top of the org chart. 1:09 So, for myself here, I've got division, department, engagement, which pertains to the employee's basis of employment. As well as the location. 1:19 Another thing that you can do is share the org chart, so you might have, uhm, an intranet, or something of that nature. 1:26 Maybe you need to share your organizational structure for auditing purposes. Thank us. See you next time. Export it to a PDF can make it quite small, so what we usually recommend is that you share it dynamically. 1:38 The way to do this is by selecting the person at the top of the node, or if you just want it to be a department that you're sharing, you would select the person at the top of that particular node. 1:47 Otherwise, if we just want to share the entire thing, we're going to select David Clark, the principal here, and we're going to select share. 1:57 A link will come up as a URL that we can then copy and paste into the web browser. Share that work chart to anyone outside of our organisation.
2:12 Now, people outside the organisation can't click into the employee's profile, they can just see at a glance what the organisational structure looks like. 2:19 The next thing that we can do as well is we can look at a breakdown of the FTE. So if we click on the reporting or the iChart at the top there, we can break down the entire organisation. 2:35 Total positions, their total FTE, uhm, and any other filled or vacant sort of data as well. We can change the colour of these nodes as well by clicking in, clicking on the three dots there. 2:51 Going edit, and then changing the node colour here. The chart is also what we use to kick off processes such as recruitment, onboarding, employment changes, which you can see are highlighted occurring here as well as offboarding. 3:10 So if we click on Claire Spencer and we click on the little person on the corner of my right, we're gonna be presented with a bunch of options here. 3:20 So we can recruit under her position, we can recruit into her position if she might be leaving, as well as make employment changes, offer an additional position, which is quite useful for schools, cross-board and off-board. 3:34 So we'll start with recruiting into, ah, under her position. So if we click on that one there, it's going to bring up the option to either select from vacancies that we currently have available, or create a new vacancy. 3:46 So, press that. And next, and then this is going to initiate our request to hire process, which can be viewed in our other user guides and tutorials. 4:01 Now, in terms of data privacy, so certain permissions can view this particular org chart. So, one of the other things that we can do is we can make it. 4:11 So, that somebody in a head of role, for example, can't see anybody that's above them. So, any staff that are below Claire, they can see Claire, but they can't access her employee information. 4:23 Whereas, Claire can access the employee information of everybody that reports to her. So, this helps with, ah, data privacy, uhm, and those permissions can be set in the back end of the system, depending on who you want to have that sort of permission.